7 // Grafana Cloud
What is Grafana?
Grafana is an open-source observability platform that visualizes metrics, logs, and traces through customizable dashboards. It connects to various data sources like Prometheus, PostgreSQL, and others to provide real-time monitoring with charts, graphs, and alerts. Grafana Cloud is the managed, hosted version that includes pre-configured Prometheus for metrics storage, eliminating the need to run your own infrastructure.
Overview
Grafana is used to monitor the Supabase PostgreSQL instance. This service is not required for the project, but a nice to have to view more details about the database's performance. The free tier on Grafana Cloud is more than enough.
Create an account on Grafana Cloud.
Create Scrape Job
A scrape job is responsible for calling the Supabase metrics endpoint.
- On the homepage, on the left side menu, click on the drop-down for connections and choose to add a new connection.
- Search for Supabase.
- Give the Scrape Job a name.
- Supabase recommends to leave the scrape interval to every minute.
- Input the Supabase project ID. This can be found under Settings > General in Supabase.
- Input a Supabase secret key. This can be found under Settings > API Keys > Secret Keys in Supabase. Create a new one for Grafana.
- Click Test Connection.
- If test connection is successful, click on Save Scrape Job.
- Finally click Install.
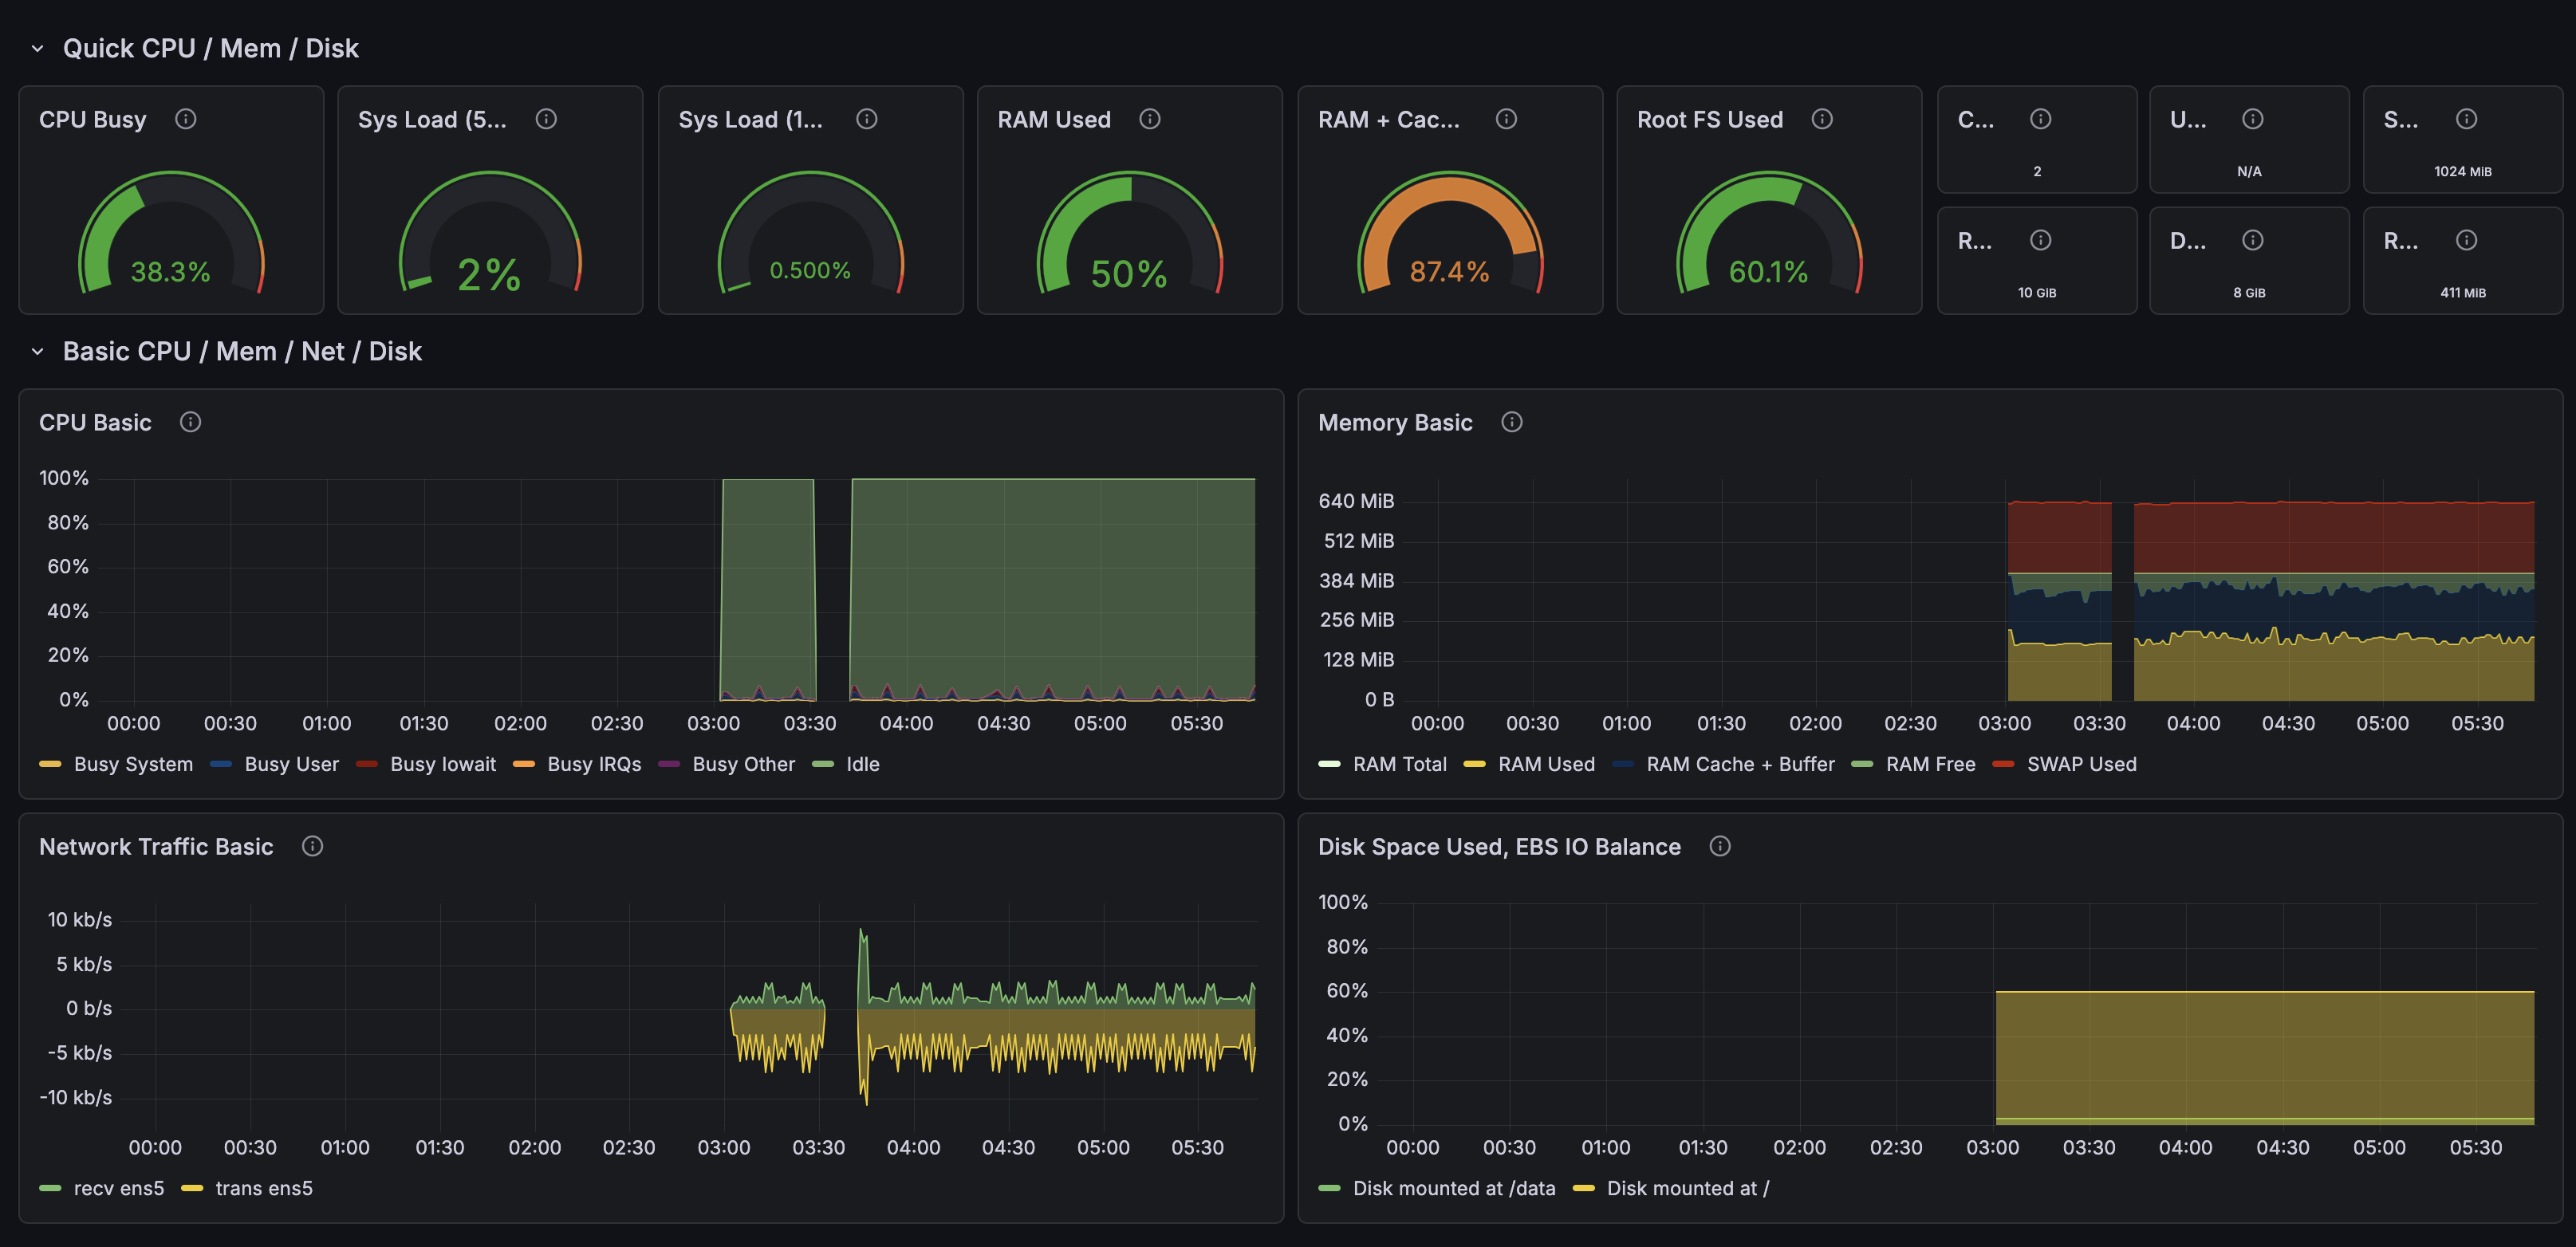
Import Supabase Dashboard
Supabase has a premade dashboard ready for use in a .json format that can be imported via the Grafana UI.
- On the left side menu, click on Dashboards.
- In the upper-right, click on the New dropdown, then choose Import.
- Copy or download this
.jsonfile from supabase/supabase-grafana. - Upload or paste the
.jsonfile or code into the respective section in the Grafana UI. - Click Load. A prompt should appear to choose a data source. Choose the Prometheus instance that receives the Supabase metrics.
- The dashboard should be ready to view.
Warning
The uid for will need to be updated manually if the prompt for choosing a data source does not appear. If so, the dashboard
will have errors on each visual. To fix this, perform the steps below.
-
Grab the
uidfor the Prometheus data source.- On the left side menu, click on the Connections dropdown. Then, choose Data Sources.
- Search for "prom" and then click on the default Prometheus data source.
- In the URL of that page, the last section is the
uid:/datasources/edit/<uid>.
-
Edit the JSON Model in the Dashboard.
- Visit the dashboard and then click on Edit in the upper-right.
- Click on Settings.
- Click on the JSON Model tab.
- Grab the JSON code and using a text editor like VS Code, paste the code and search for
"uid": "prometheus". - Choose to change all occurrences of
"uid": "prometheus"to"uid": "<uid>" - Copy the updated JSON code and paste it into the Grafana UI.
- Save changes and head back to the dashboard.
Related Supabase documentation.